I attended a Public Meeting on IPCC Report by Professor Michael Grubb in Reading on 24th April 2019.
He admitted that he was not a scientist, but that his speciality is in the economics of Climate Change.
During the Q&A session after the lecture, I had the temerity to mention that Solar Energy was not available at night.
He took great exception to this, and sarcastically asked if I really thought that his scientists were unaware of it.
I have since found that the characteristics of Solar Energy are in fact for worse than
the simple night and day dichotomy implies.
This article explains my concerns.
Analyzing Great Britain's Solar Energy
For some years, the University of Sheffield has been reporting the amount of solar energy being generated
across Great Britain. (Northern Ireland is not included.)
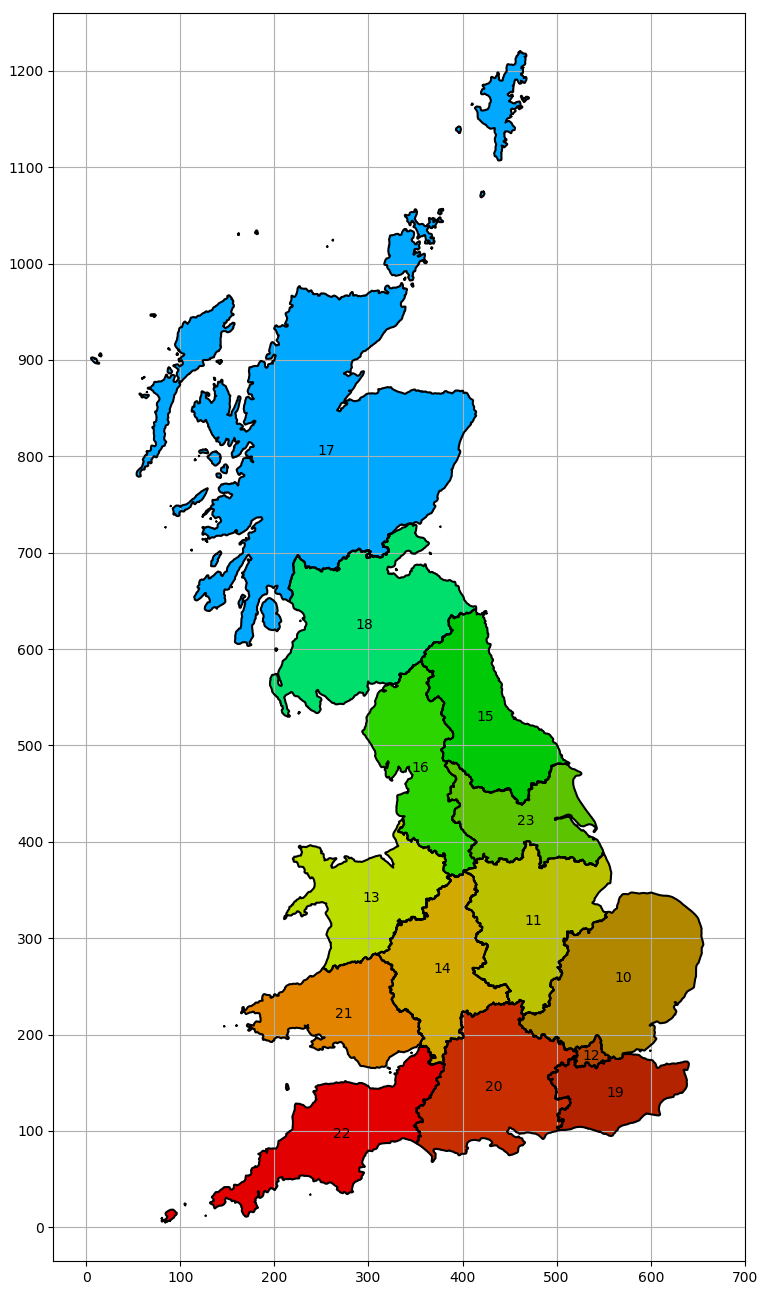
For this purpose, the country is divided into fourteen regions, corresponding to regional electricity generating companies.
These are:
Region
Name
Centroid OSGB36
Centroid WGS84
10
Eastern England
(570322, 260256)
(52.214, 0.492)
11
East Midlands
(474741, 319488)
(52.768, -0.894)
12
London
(536593, 179382)
(51.497, -0.034)
13
Merseyside & North Wales
(302365, 343859)
(52.983, -3.456)
14
West Midlands
(377953, 270349)
(52.331, -2.325)
15
North Eastern England
(423410, 531608)
(54.679, -1.639)
16
North Western England
(354875, 478765)
(54.203, -2.693)
17
Northern Scotland
(255251, 806836)
(57.130, -4.393)
18
Southern Scotland
(295498, 626926)
(55.525, -3.657)
19
South Eastern England
(562268, 140942)
(51.145, 0.318)
20
Southern England
(433278, 147663)
(51.227, -1.525)
21
Southern Wales
(273544, 222918)
(51.890, -3.839)
22
South Western England
(271383, 098847)
(50.775, -3.826)
23
Yorkshire
(466734, 423286)
(53.702, -0.991)
Solar PV regions in Great Britain.
The centroid of each region is given in OSGB36 (OS Grid Map),
and WGS84 (GPS latitude and longitude) coordinates.
Map of the Solar-PV regions,
with OSGB36 coordinates in kilometres.
The colour of each region is related to its latitude.
For each region, the Sheffield PV project captures the photovoltaic power made available to the grid every thirty minutes.
This dataset is available for free download.
I have analyzed the Sheffield data in some detail for the whole year of 2019.
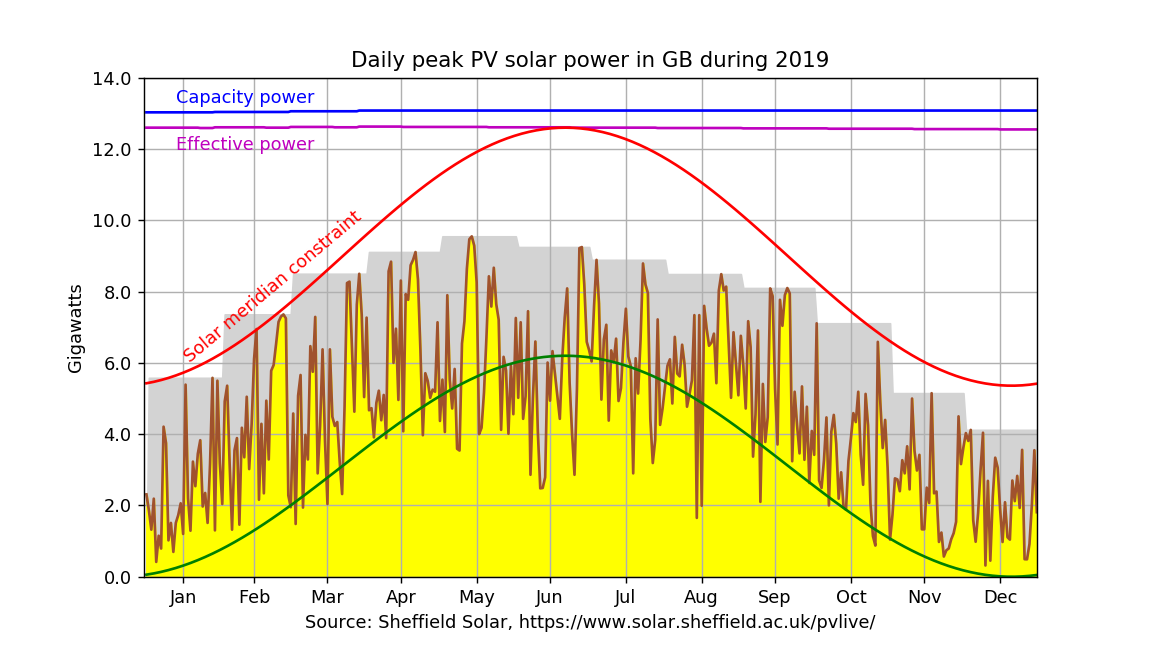
The first chart shows the daily peak energy through the year.
The horizontal blue line is the published total capacity, and the magenta line shows what Sheffield call the
effective capacity, without explanation.
This does vary slightly through the year, so it may relate to units being brought on and off line.
The main part of the chart shows the daily peak energy, which is the maximum power that was delivered on each the day, even if it was only for a few minutes.
The graph is very spiky, showing the intermittent nature of solar power.
Since it shows peak power values, it is also more optimistic than a mean power display would show.
The grey columns behind the daily numbers represent the monthly peak values.
The red curve is an experimental feature: the power variation over the year is expected to follow
a sinusoidal pattern due to the variation in the declination of the Sun,
because of the obliquity of the ecliptic.
The curve shown is an attempt to fit the variation in the declination to the observed variation in power.
I realized after producing these charts that what is more significant is the altitude
of the Sun above the horizon, which is slightly more complicated to calculate.
I will change the displays to show solar altitude in a later version.
it probably has no immediate physical significance.
What is striking is that the summer peak in energy (in 2019) did not appear, as expected, at the summer solstice, but in May.
The output near the summer solstice in June is actually very poor.
I can only assume that this is due to cloudy or stormy weather, rather than the alignment of the Sun.
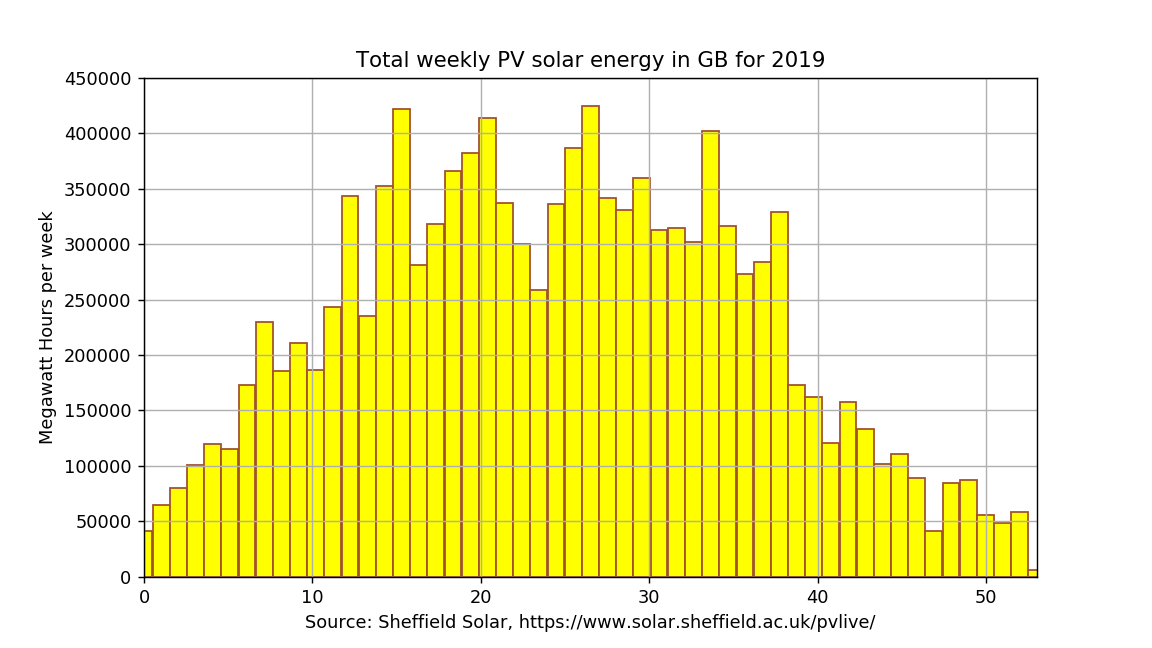
We can smooth out the spikes somewhat by showing the results as weekly totals.
Each bar below shows the total megawatt hours generated during each week.
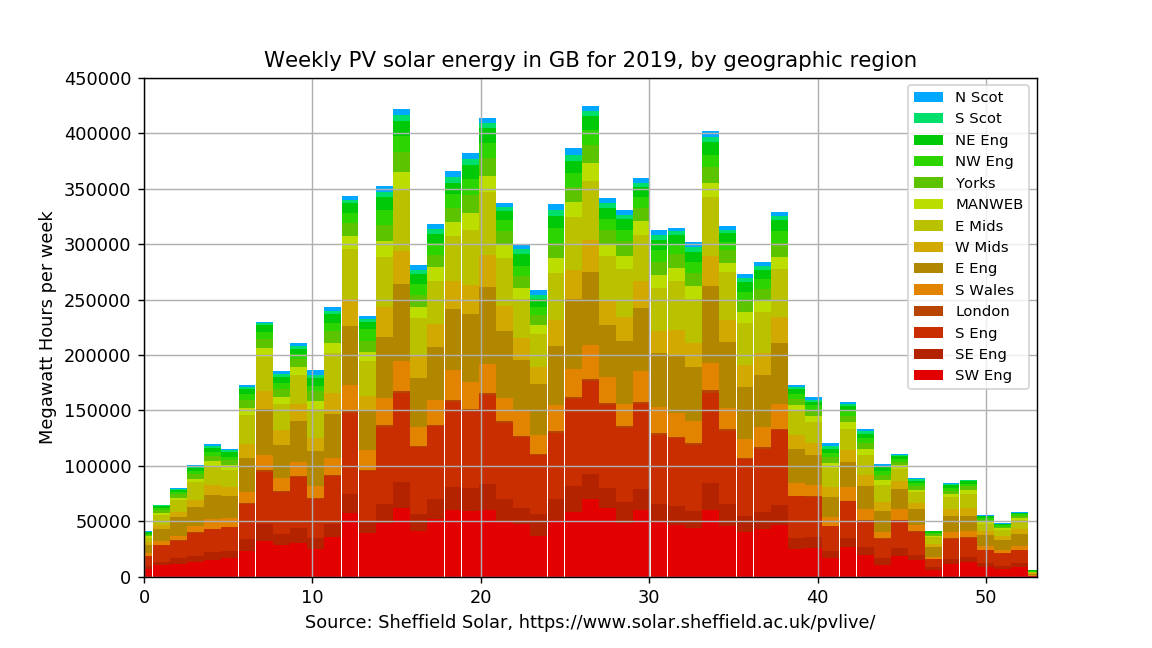
Here is the same chart, but with the results shown by geographic region, using the same colour scheme as the map above.
The contributions from the northern regions, especially Scotland, are very small, as expected.
This might be just because of the lower insolation at higher latitudes, but is more likely because there
are fewer solar installation because the return on investment is lower (because of the lower insolation).
We can express the total amount of energy produced over the whole year
as a fraction of the claimed nameplate capacity.
The results are underwhelming.
Total capacity for year:
114,503,595 MWh
Total effective capacity:
110,326,545 MWh
Total energy generated:
11,749,525 MWh
Total as fraction of total capacity:
0.10
Total as fraction of effective capacity:
0.11
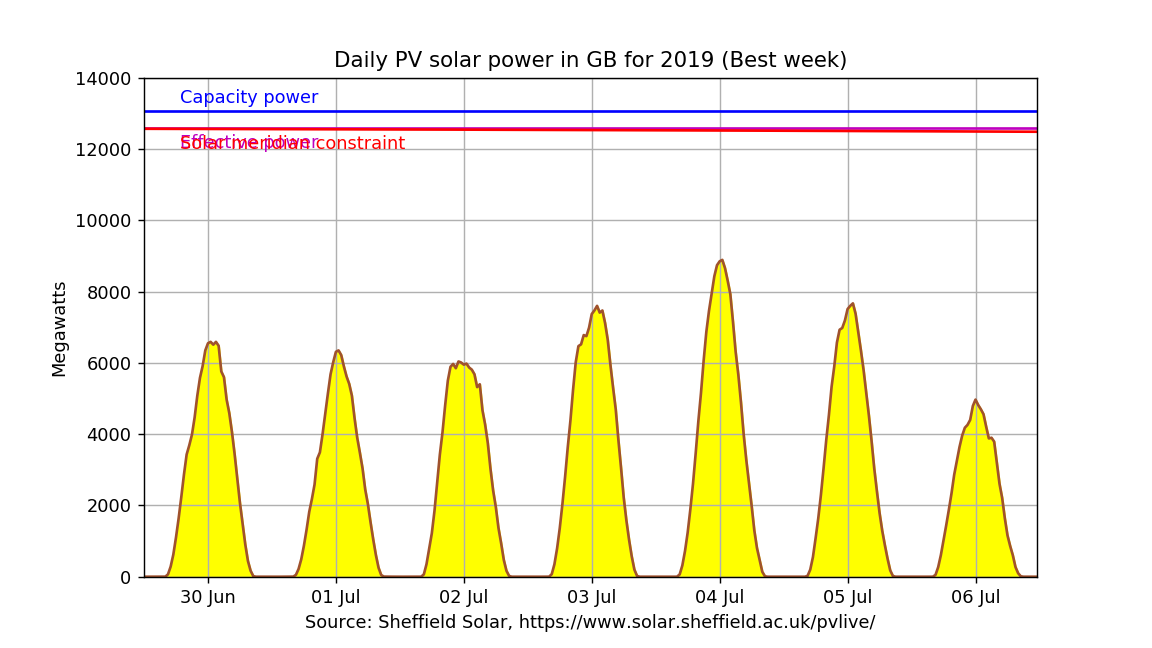
We can break down the results by individual weeks.
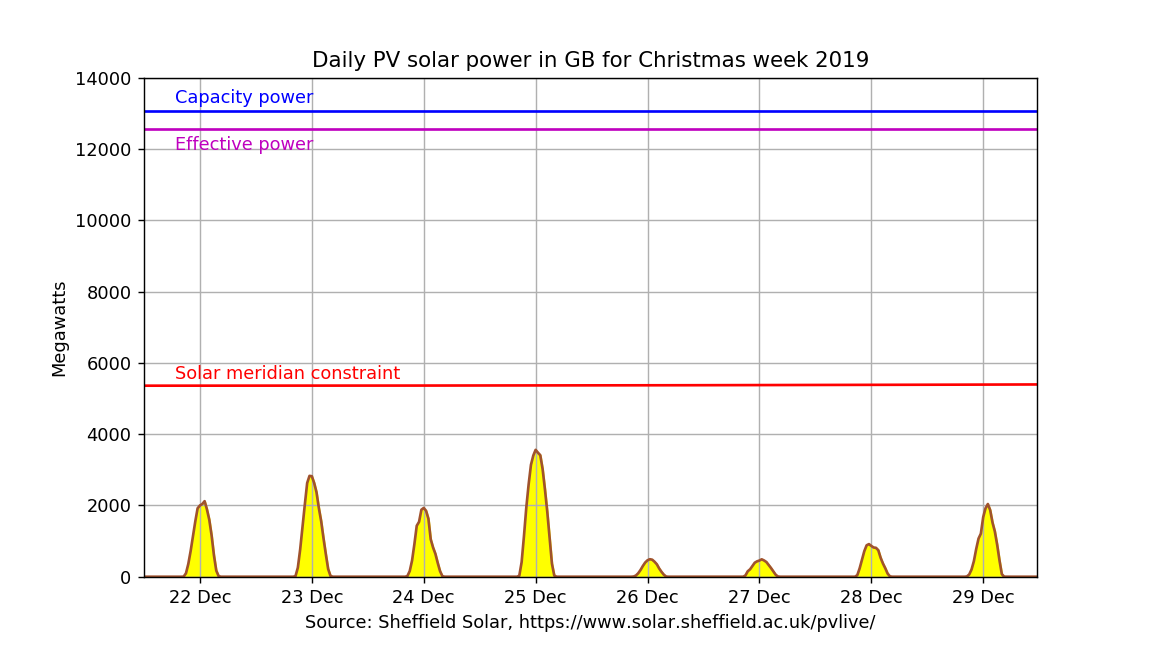
Here are the results for the best week in the year (30 June 2019),
and for Christmas week (22 Dec 2019), one of the worst.
We see that even during the best week,
the promised nameplate power is never actually delivered.
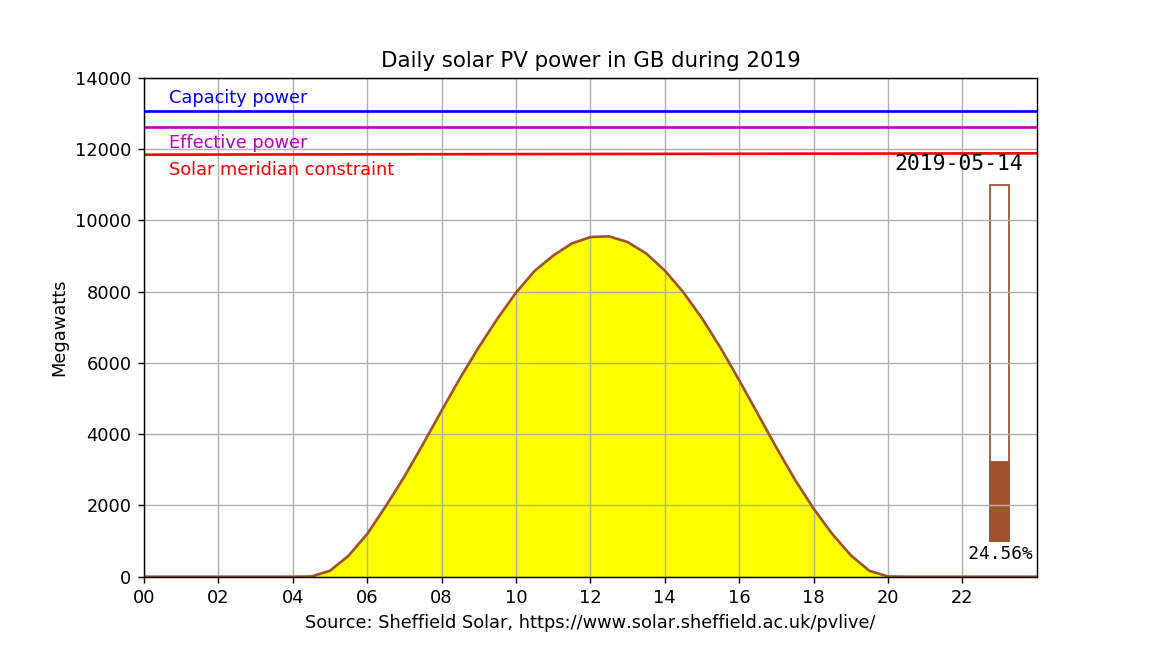
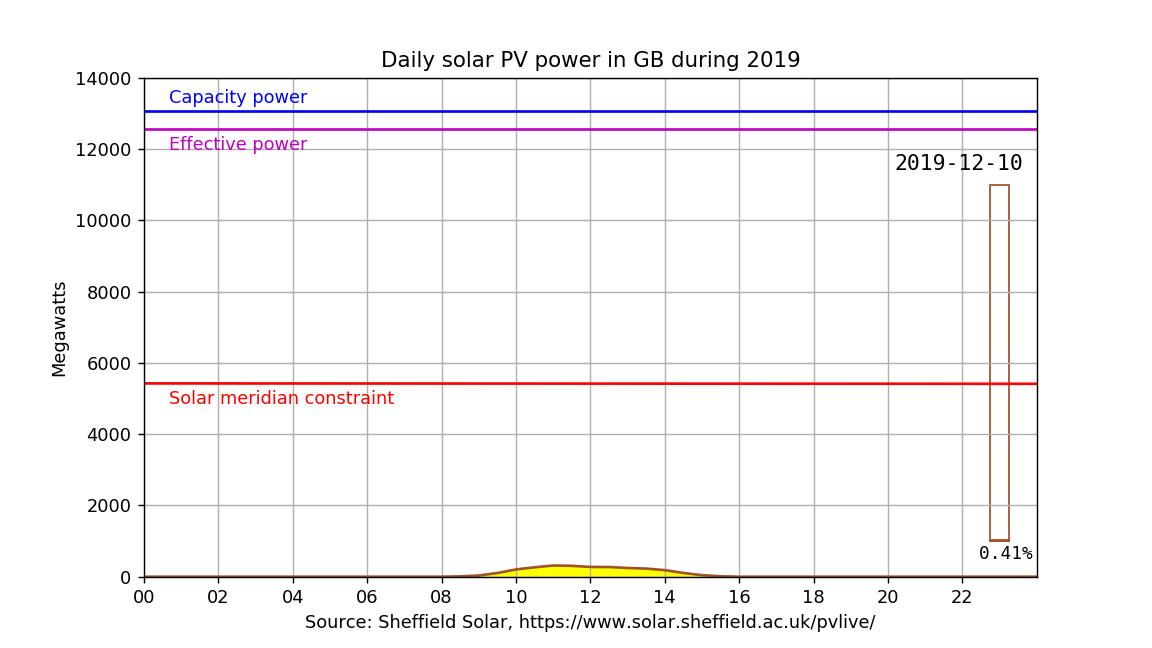
We can also compare the very best day (14 May 2019) with the very worst (10 Dec 2019).
The poor annual energy percentage suggests that we should show the individual energy
percentage for each day, and this is shown at the right of each chart below.
It is the total energy for the day expressed as a percentage of the total capacity for the day.
Although it reaches nearly 25% in May, it is only 0.4% on the worst day.
The 14 May chart shows what could be regarded as an optimum distribution for a day.
It is almost a pure sine curve, peaking near midday.
I assume that the weather across the country was uniformly clear and cloudless.
Notice that there are slight shoulders on the curve near sunrise and sunset.
I presume that these are due to atmospheric diffraction of the sunlight at those times.
The 10 December chart shows how really dire the winter output can be.
The Sun doesn't rise until 9 a.m, and it is set again by 3 p.m.
In between, the Sun barely glimmers, presumably due to excessive cloud cover.
Remember that this is the output for the entire country.
The daily charts are visualized dynamically in the following videos.
(Click or tap for full screen.)
The science bits
Here is some of the science behind these results.
It's a bit rudimentary at present. I hope to expand it in due course.
Keeping the Sun shining
Solar Energy comes from the Sun, at the centre of the Solar System,
so a little astronomy and astrophysics is in order.
The proton-proton reaction that powers the Sun.
By Sarang -
Own work,
Public Domain, Link
The Sun is a huge nuclear fusion reactor that derives most its energy from fusing hydrogen atoms into helium atoms.
At the very high temperatures inside the Sun, matter forms a plasma: a chaotic soup of elementary particles
in which electrons are detached from their atomic nuclei.
So the hydrogen and helium at the Sun's core exist as pure nuclei.
A solo hydrogen atom is just a single proton.
Deep within the Sun's core, protons occasionally collide and merge together to form deuterium,
a form of hydrogen nucleus containing a proton and a neutron.
This needs one of the protons to convert to a neutron by the emission of a positively charged electron called a positron.
It is a very rare event, which only happens every nine billion years for an individual proton,
but because of the huge number of protons in the Sun, it is actually extremely frequent.
Within a few seconds, the new deuterium nucleus combines with another proton to form a light helium nucleus,
containing two protons and one neutron.
Finally, after about 400 years, pairs of light helium nuclei collide to produce regular helium nuclei
with two protons and two neutrons, releasing two free protons.
The net result of these interactions is that four hydrogen nuclei combine into one helium nucleus, while emitting two positrons and two neutrinos, and energy in the form of gamma rays.
The positrons seek out normal negatively-charged electrons in the plasma soup, and they mutually annihilate,
producing even more gamma ray energy.
Some of the hydrogen and helium nuclei make their way to the cooler photosphere in the Sun's outer atmosphere,
where they capture electrons to become neutral atoms.
These atoms, along with those of other elements, cause absorption lines in the Sun's spectrum.
The high-energy gamma rays produced by the nuclear fusion also cool down to produce radiation at lower frequencies,
such as X-rays, ultraviolet, visible light, infrared, and radio waves.
The Earth in space
The Earth is about 150 million kilometers from the Sun, and revolves about it in one year, by definition.
But the exact length of the year in seconds varies from year to year due to a number of different astronomical effects.
In 2019 the tropical year was 365d 5h 51m 4s.
The Earth also rotates on its axis, once per day.
But again, the exact length of the day is variable, due to variations of the speed of the Earth in its orbit.
It is also increasing, inexorably, because of the tidal effect of the Moon, so that a leap second
needs to be introduced into the calendar from time to time.
The daily rotation and the yearly revolution are not exactly synchronized, so an extra leap day has to
be introduced about every four years to keep the calendar in step with the seasons.
The rules for defining leap years are known as the Gregorian Calendar, introduced by Pope Gregory XIII in 1582.
It was not adopted in the English-speaking world until 1752.
The tilted Earth
The axis of the Earth is not aligned with its orbit around the Sun.
It is tilted at an angle of about 23.45 degrees.
This tilt is also known as the obliquity of the ecliptic,
and has been calculated over a period of 20,000 years by J Laskar.
The ecliptic is the apparent path of the Sun through the sky.
It is also the projection of the Earth's orbit around the Sun on to the sky.
The tilt precesses with a period of 25,772 years, and nutates with a period of about 18.6 years.
The centre of the circle of precession is at the ecliptic pole in the constellation of Draco,
at RA 18h 00m, Dec 66 deg 33 min.
This apparent coincidence is because the effect is caused by the Sun, which is always on the ecliptic, and the Moon, which is very close to the ecliptic.
The solar altitude
The solar altitude $\alpha_s$ is the height of the sun over the horizon, expressed as an angle.
It is complementary to the solar zenith angle $\theta_s$, which it the angle between the Sun and the zenith,
the point directly overhead.
Complementary, in geometry, means that the two angles add up to a right angle: $\alpha_s + \theta_s = 90^{\circ}$.
The angles are given by the formulae in [Wikipedia] (which I think is just the cosine law for spherical geometry):
$$
\cos \theta_s = \sin \alpha_s = \sin \Phi \sin \delta + \cos \delta \cos h
$$
where $\Phi$ is the local latitude, $\delta$ is the solar declination, and $h$ is the local hour angle.
where $L$ is the observer's latitude, $d$ is the day of the year, $\varepsilon$ is the axial tilt ($23.44^{\circ}$, or $0.4091$ rad),
and $\phi_{\unicode{x2609}}$ is the ecliptic longitude.
Note that the insolation is presumably a sinusoidal function of the altitude.
Effects on Solar Power
The astronomical movements of the Earth with respect to the Sun have a dramatic effect on the capture of solar energy.
The axial tilt of the Earth means that the Sun is higher in the sky during the summer, and lower in the sky during the winter.
In summer, sunrise is earlier and sunset is later, and the Sun is higher in the sky at noon.
In winter, sunrise is later and sunset is earlier, and the Sun is lower in the sky at noon.
Calculating the frequency of proton to neutron decay in the Sun:
Solar mass M⊙ ≈ 2×1030 kg.
Proton mass Mp ≈ 1.67×10⁻²⁷ kg.
Fraction of M⊙ that is protons ≈ 0.70.
Fraction of M⊙ that is helium ≈ 0.28.
Since the helium nuclei are four times more massive than the hydrogen nuclei,
fewer of them are needed to make up the mass,
so (number of H nuclei):(number of He nuclei) ≈ 70% : (28%/4) ≈ 70:7 ≈ 10:1.
So 10/11 (0.9) of the free nuclei in the Sun are protons.
So the total number of free protons in the Sun is about 0.9 × M⊙ / Mp
≈ (0.9 × 2 / 1.67) × 1057 ≈ 1.1×1057.
Proton to neutron decay time ≈ 9×10⁹ years ≈ 31,557,600 × 9×109 seconds ≈ 284,018,400×109 ≈ 2.8×10¹⁷ seconds.
So the frequency of proton-neutron decays in the Sun ≈ 1.1×1057 / 2.8×10¹⁷ ≈ 0.4×1040, or 4×1039 per second.
Comparing alpha particle and proton masses:
Mass of a proton: $1.672 621 923 69 \times 10^{-27}$ kg
Mass of an alpha particle: $ 6.644 657 3357 \times 10^{-27}$ kg
Alpha/proton mass ratio: $3.972 599 690 09$.
The difference in mass between an alpha particle and four protons is due to the binding energy,
which is the energy required to pull the alpha particle apart, and using the matter/energy equivalence
implied by Einstein's theory, $E = m c^2$.
But this is a circular argument: the binding energy is derived by assuming $E = m c^2$.